In the previous article we took apart the reflect package and found that its magic is mostly the compiler leaving very good notes — type descriptors frozen into read-only data at build time, and a package that knows how to walk them. The whole article was about reading metadata that was already sitting in memory before main even started. Today we shift the perspective. Profiling is the runtime catching your program in motion — sampling what it's doing and where it's spending its time, then accumulating that into something you can open with go tool pprof. The heart of every sample is a call stack, produced with the same unwinder we saw in the Stacktraces article . So profiling is really live moment-catching sitting on top of build-time stack-reading.
Zero-Copy Context Bridging Gateway for Multi-Agent GPU Inference. Bypasses the expensive prefill phase by dynamically stitching KV Caches at the memory level using PagedAttention. Cuts TTFT latency...
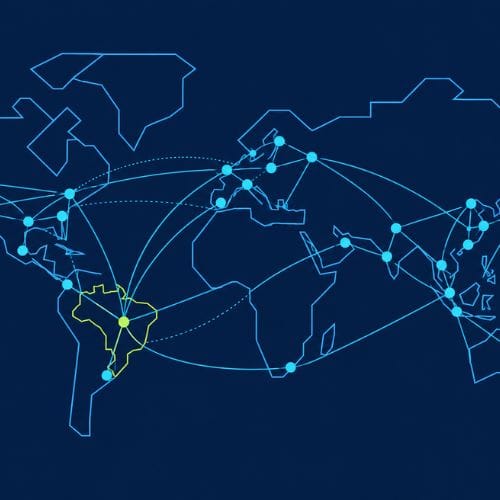
During my bachelor's, I picked up Albert-László Barabási's Network Science book for a research project. The premise is elegant: protein interactions, power grids, social media feeds, financial markets, and many other complex systems can be modeled as graphs, with objects as nodes and relationships as edges. Once you have a
Next-gen container runtime with zero-copy DAG storage and P2P image sync. Run OCI images as Linux containers, Firecracker microVMs, or Apple Silicon VMs. - pullrun/pullrun
DolphinDB is a real-time computing platform based on a high-performance distributed time series database that supports complex computing and stream processing. It not only supports efficient storage and query of massive data, but also provides a full-featured programming language to support complex analysis, as well as a high-throughput, low-latency, and easy-to-develop streaming data analysis framework. It is one of the database systems with the strongest computing power.