
Bluegraph – Explore NOAA buoy data, rebuilt in 3D from measured spectra
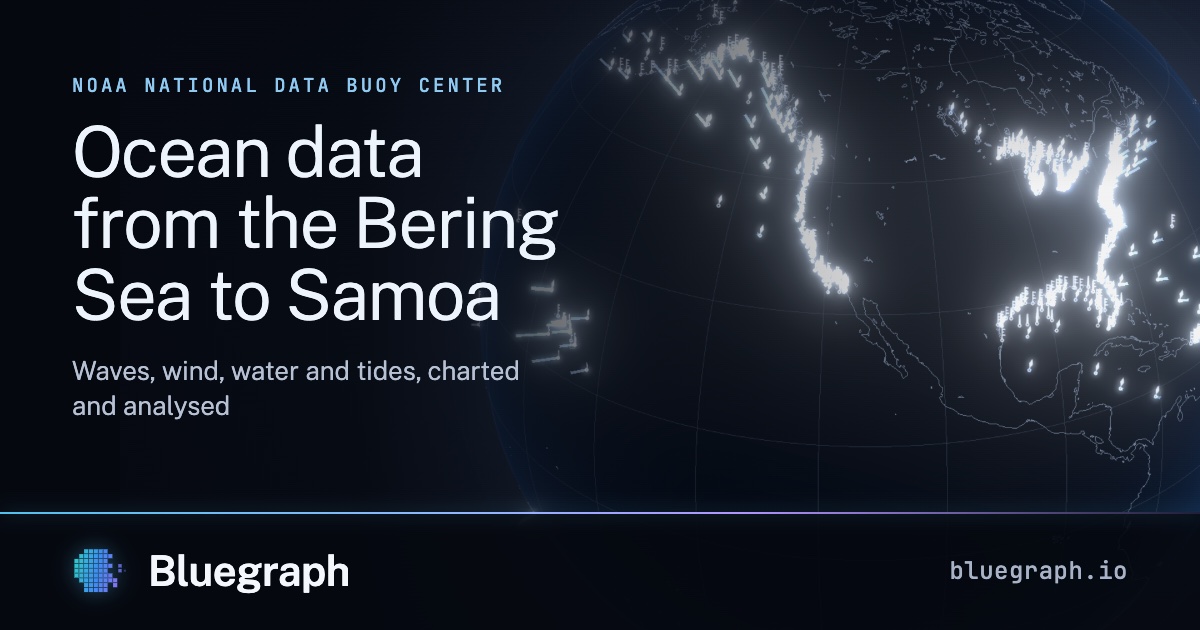
Waves, wind, water and tides from NOAA's network of buoys, coastal stations, tide gauges and estuaries, from the Bering Sea to Samoa, charted and analysed.
Summary
Bluegraph visualizes NOAA’s buoy data in a 3D format, providing insights into wave, wind, water, and tidal conditions across diverse regions, including the Bering Sea and Samoa. This tool enhances understanding of environmental dynamics through detailed graphical representations.
Comments (2 of ) ⌛